
• AI Enablement
How to Measure AI Adoption Without Mistaking Logins for Impact
The dashboard says adoption is up. The business case says value is unclear. Both may be true.
By Suchetana Bauri · Published February 2026 · 14 Min Read
Key takeaway
Real adoption is not when people use AI. It is when people can use it capably and responsibly to do a defined piece of work better.
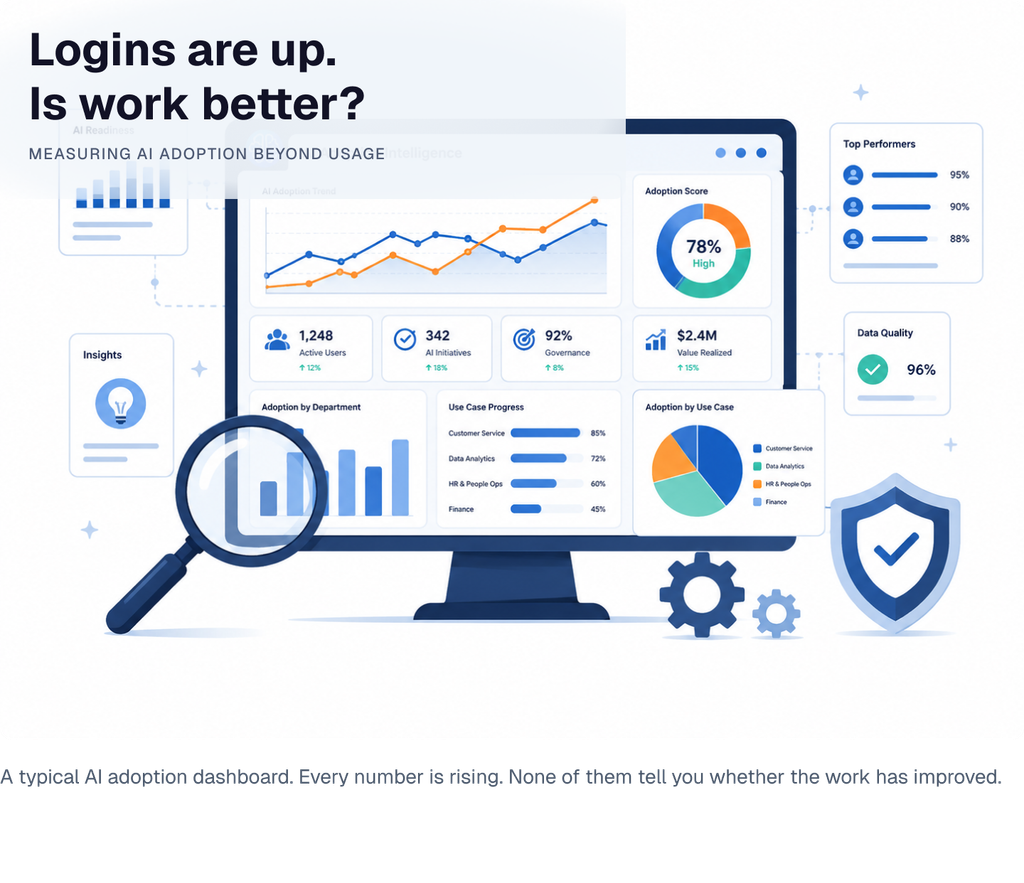
A familiar scene is playing out inside organisations: leadership buys an AI tool, enables thousands of accounts, watches the monthly-active-user chart rise and declares adoption a success. Then, a few months later, managers are unable to point to a process that is reliably better, an outcome that has improved or a risk that has fallen.
This is not a failure of measurement in the narrow sense. It is a management failure.
A login tells you that someone opened a tool. It does not tell you whether they used it well, whether they trusted it appropriately, whether it changed the way work moved through the organisation, whether the output needed rescuing, or whether it made a meaningful difference to customers, colleagues or costs.
The hard truth is that many AI dashboards are built to prove activity, not impact. They count licences, prompts, active users, training completions and feature clicks because those numbers are readily available. The resulting figures look clean, immediate and reassuring. Yet they are dangerously easy to mistake for evidence that AI has been adopted.
Speed without quality is not productivity. More output without judgement is not capability. And a high rate of use without a better workflow may simply mean that people are doing the same work twice: once with AI, then again to correct it.
A recent WalkMe survey illustrates the gap. While 90% of respondents said they felt confident using AI at work, only 24.6% said it worked on the first attempt, and 50.2% said there had been times when using AI took longer than doing the task manually.
If your organisation is reporting AI adoption through logins alone, it is not measuring adoption. It is measuring access.
• 01 / The Maturity Matrix
The five layers of AI adoption
Adoption is not a binary state. To see whether AI is actually taking hold, separate basic access from changed work and measurable value.
From access to impact
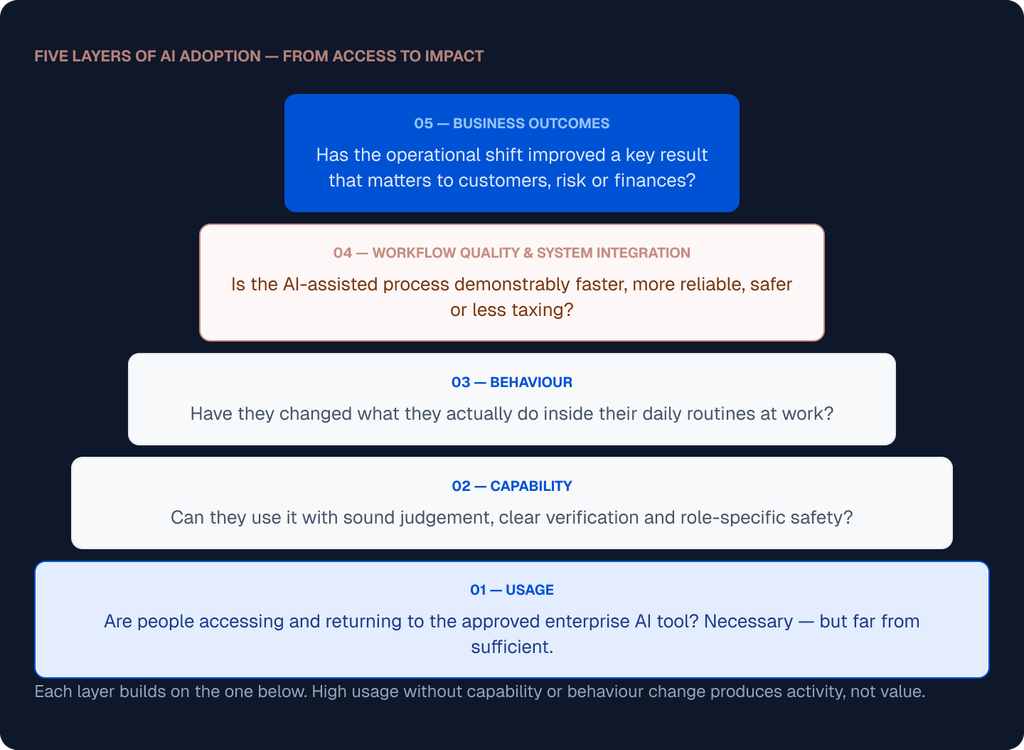
A team can have extremely high usage and low capability. Conversely, a quiet specialised unit may have modest logins but high strategic impact because they completely redesigned one high-friction bottleneck.
What to measure — and what not to
Do not measure
Logins alone
Training attendance
Self-reported hours saved
Aggregate adoption rate
Licence activation
Measure instead
Role-specific capability and judgement
Net time saved including rework
Workflow quality by use case
Business outcomes that matter
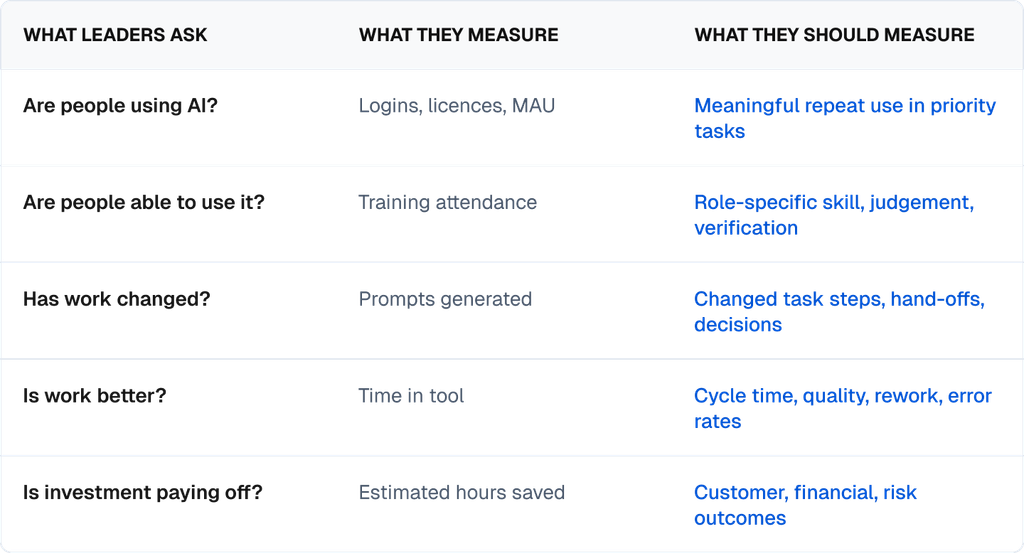
Different leadership questions require different evidence. The matrix below links common adoption questions to the measures that are most likely to reveal what is really happening.
Measurement alignment matrix
What is meaningful repeat use?
Meaningful repeat use is not opening an AI tool twice in a month. It is using an approved tool repeatedly for a defined, appropriate task — with the required human checks — and producing work that meets the agreed quality standard.
• 02 / Seductive Proxies
Why logins are such a seductive metric
We optimise what is easy to gather. Logins are exported instantly with standard SaaS reporting dashboards. However, counting system pings oversimplifies adoption. Here are five core reasons logins remain poor indicators of business progress:
The login illusion
- Access is not use: Opening an empty tab is a system login, but leaves work completely untouched.
- Use is not meaningful use: Copy-pasting repetitive prompts is not the same as resolving unique customer problems.
- Frequency is not quality: Generating more rapid drafts of mediocre value degrades system outcomes overall.
- Self-reported time is incomplete: Initial time savings often mask the extra reviews required later.
- Aggregate figures conceal uneven results: Broad averages hide the high-value pockets doing the actual heavy lifting.
Even so, a field study of more than 5,000 customer-support agents found that access to a generative AI assistant increased issues resolved per hour by 14% on average, with larger gains among less experienced workers. The lesson is not that every AI deployment produces a 14% gain. It is that outcomes vary by task, workforce and implementation — which is exactly why a single adoption figure tells you so little.
• 03 / Capability Diagnostics
Measure capability, not just confidence
Confidence is an attitude; capability is an observable practice. Self-reported confidence can overstate practical capability, particularly when employees have not yet had to verify a flawed output or manage a high-stakes task. If we test their ability to identify structural bias, hallucinations, or verify data provenance, the gap appears immediately.
Test judgement in real work
Confidence matters, but it is not enough. To understand whether employees can use AI safely and well, test judgement in situations that resemble the work they actually do.
Instead, use five practical diagnostics:
- Scenario-based assessments: Test real-time verification choices during key deliverables.
- Observed-practice reviews: Review live human-in-the-loop validation patterns.
- Calibration checks: Ask, “Under what conditions should we explicitly avoid AI generation?”
- Policy and governance tests: Clarify enterprise safety boundaries and escalation pathways.
- Task-abandonment tracking: Identify where teams open a tool but abandon it because the output needs too much correction.
The standard that matters
A good measure of capability asks: Can this person use AI responsibly for a task that matters in their job, without creating hidden work or hidden risk for someone else?
• 04 / Integrated Practice
Look for behaviour change in the workflow
We must stop treating AI adoption as an abstract, general skill. It is an operational intervention that changes specific steps in existing sequences. To make this visible, every priority use case requires a defined operational baseline.
In practice, for each priority use case, specify who is doing the work, what slows them down now, where AI enters the process and who checks the result.
For instance, instead of saying ‘Marketing has a 72% AI adoption rate,’ say: ‘In the campaign-briefing workflow, 58% of eligible briefs now use the approved template; median first-draft time has fallen; correction rates have remained stable.’
Worked example” AI-assisted campaign briefs
Context
A marketing team wants to use AI to improve campaign briefing. Its goal is not simply more AI use. Instead, the team wants to reduce the time spent assembling first drafts while protecting factual accuracy and strategic quality.
Baseline
A first campaign brief takes six hours, typically involves three hand-offs and needs an average of two substantial revisions.
AI-assisted workflow
The strategist uses an approved template, source pack and brand guidance to create a first draft. A human reviewer checks claims, audience assumptions and recommendations before the brief goes to the account lead.
Leading measures
Percentage of eligible briefs using the template; employee capability assessment; completion of reviewer checks.
Quality measures
Accuracy issues; number of substantive revisions; stakeholder rating of brief quality.
Outcome measures
Time from request to approved brief; campaign launch speed; account-team satisfaction.
If the drafting time falls but revisions rise, the team has not yet achieved productivity. It has moved work downstream.
• 05 / Quality Guardrails
Treat quality and rework as core adoption metrics
This is why the most common measurement mistake is counting time saved at the start of a task while ignoring the downstream rework. If a draft is generated in ten seconds but requires forty minutes of manual repair by an editor or senior reviewer, the net efficiency of the system is negative.
Content Creation Roles
Track first-draft generation speed against final editor correction cycles. High initial speed often conceals intense subsequent polishing.
Customer Service Workflows
Balance raw response times with final issue resolution rates. Quick answers that fail to resolve problems increase downstream support load.
Technical/Engineering Environments
Weigh codebase volume increases against final security findings, regression bugs, and architectural test failures during key deployment windows.
• 06 / Business Scorecard
Connect the scorecard to business outcomes
Connect a task to an outcome
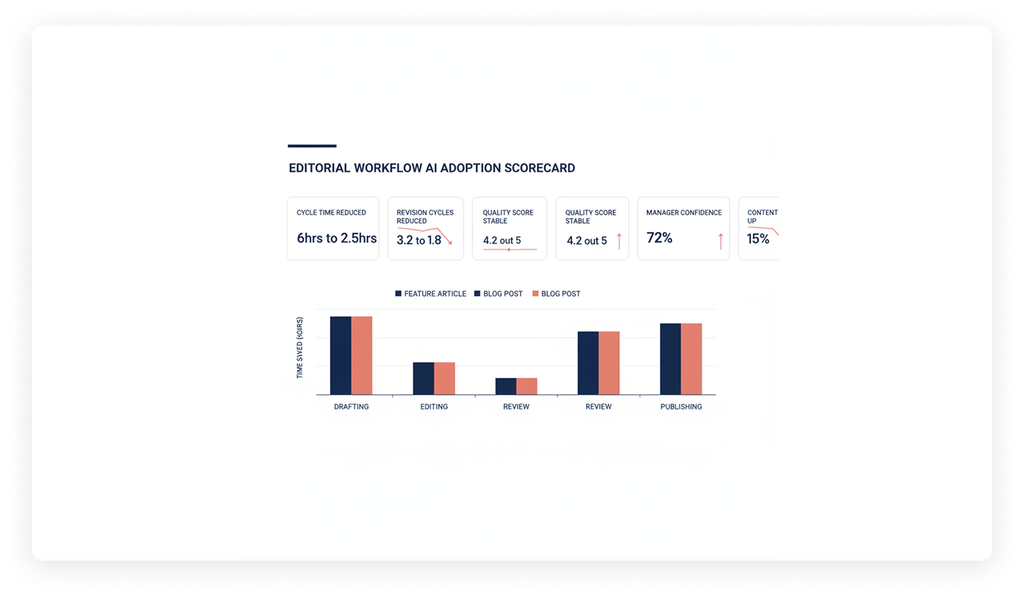
To avoid that trap, a useful scorecard links one changed task to one operational measure, one quality check and one business outcome. Use this structured scorecard template to keep system changes anchored in verified business value:
Use Case
Operational Measure
Quality / Risk
Business Outcome
CS Response
Response cycle time
QA scores & complaints
Customer satisfaction
Proposals
Draft cycle time
Proposal accuracy rate
Win rate & pipeline velocity
Knowledge
Time to locate data
Citation accuracy rate
Faster corporate decisions
Software Dev
Task delivery speed
Code defects & CVEs
Delivery predictability
Recruitment
Candidate prep time
Fairness & compliance
Reduced time to hire
• 07 / Tactical Steps
Build a practical adoption scorecard
Finally, turn the framework into a practical plan for the next week. Start with one priority workflow and use the following checklist.
Start with one priority workflow
- Establish a baseline before activating corporate licences.
- Separate leading indicators, such as access and logins, from lagging indicators, such as output quality.
- Review results by team and task rather than through an aggregate company dashboard.
- Include risk, data-safety and alignment checks.
Ultimately, AI capability does not announce itself with fanfare. It appears in the ordinary moments when teams understand what to use, what to verify, and what to protect.
When leaders set AI-adoption targets based on usage alone, employees learn to perform adoption rather than build it. The predictable result is visible activity: more tool openings, more unnecessary prompts and more optimistic claims about time saved. Meanwhile, the harder work of redesigning processes, building judgement and improving quality is left undone.
Therefore, the next time someone presents an AI adoption dashboard, ask one simple question: What is the specific task that people no longer do manually — or now do better — because of AI, and what evidence do we have?
AI adoption will not be proved by a rising line on a vendor dashboard. It will be proved in the quiet, testable details of daily work: fewer avoidable steps, better decisions, cleaner hand-offs, stronger judgement, lower rework, safer use and outcomes that matter to people beyond the AI programme.
Count the logins. Just do not confuse them with the point.
• Common Questions
Frequently asked questions
What is the best metric for AI adoption?
No single metric can capture AI adoption. Instead, assess meaningful use, employee capability, behaviour change, workflow quality, risk and business outcomes.
How do you measure AI ROI?
Begin with a specific workflow and an agreed baseline. Then track changes in cycle time, quality, rework, risk and the relevant business result.
What is the difference between AI usage and AI adoption?
Usage means someone has accessed a tool. By contrast, adoption means people can use it capably and responsibly in a defined workflow that produces better work.
Why are AI logins a poor measure of success?
They measure access and activity, not quality of use, behaviour change, rework, trust or business value.
References
[1] WalkMe Corporate Insights, “The AI Practice Gap: Disentangling Confidence from Workflow Uptake”.
[2] National Bureau of Economic Research, “Generative AI at Work: Field Evidence from Customer Support”.
[3] MIT/Science Research, “Experimental Evidence on the Productivity Effects of Generative Artificial Intelligence”.
[4] NIST, “Artificial Intelligence Risk Management Framework (AI RMF 1.0)”.
[5] Prosci Network Research, “Distinguishing Tool Activity from Organisational Behaviour Change in System Rollouts”.